Gather ’round because I have a tale to tell. A tale of statistical daring-do, of intellectual battles fought and won (eventually), and of a book that nearly broke me but ultimately sparked a lifelong love affair with data.
The hero of our story? “The Art of Statistics” by David Spiegelhalter. The villain? My own statistically insignificant attention span.
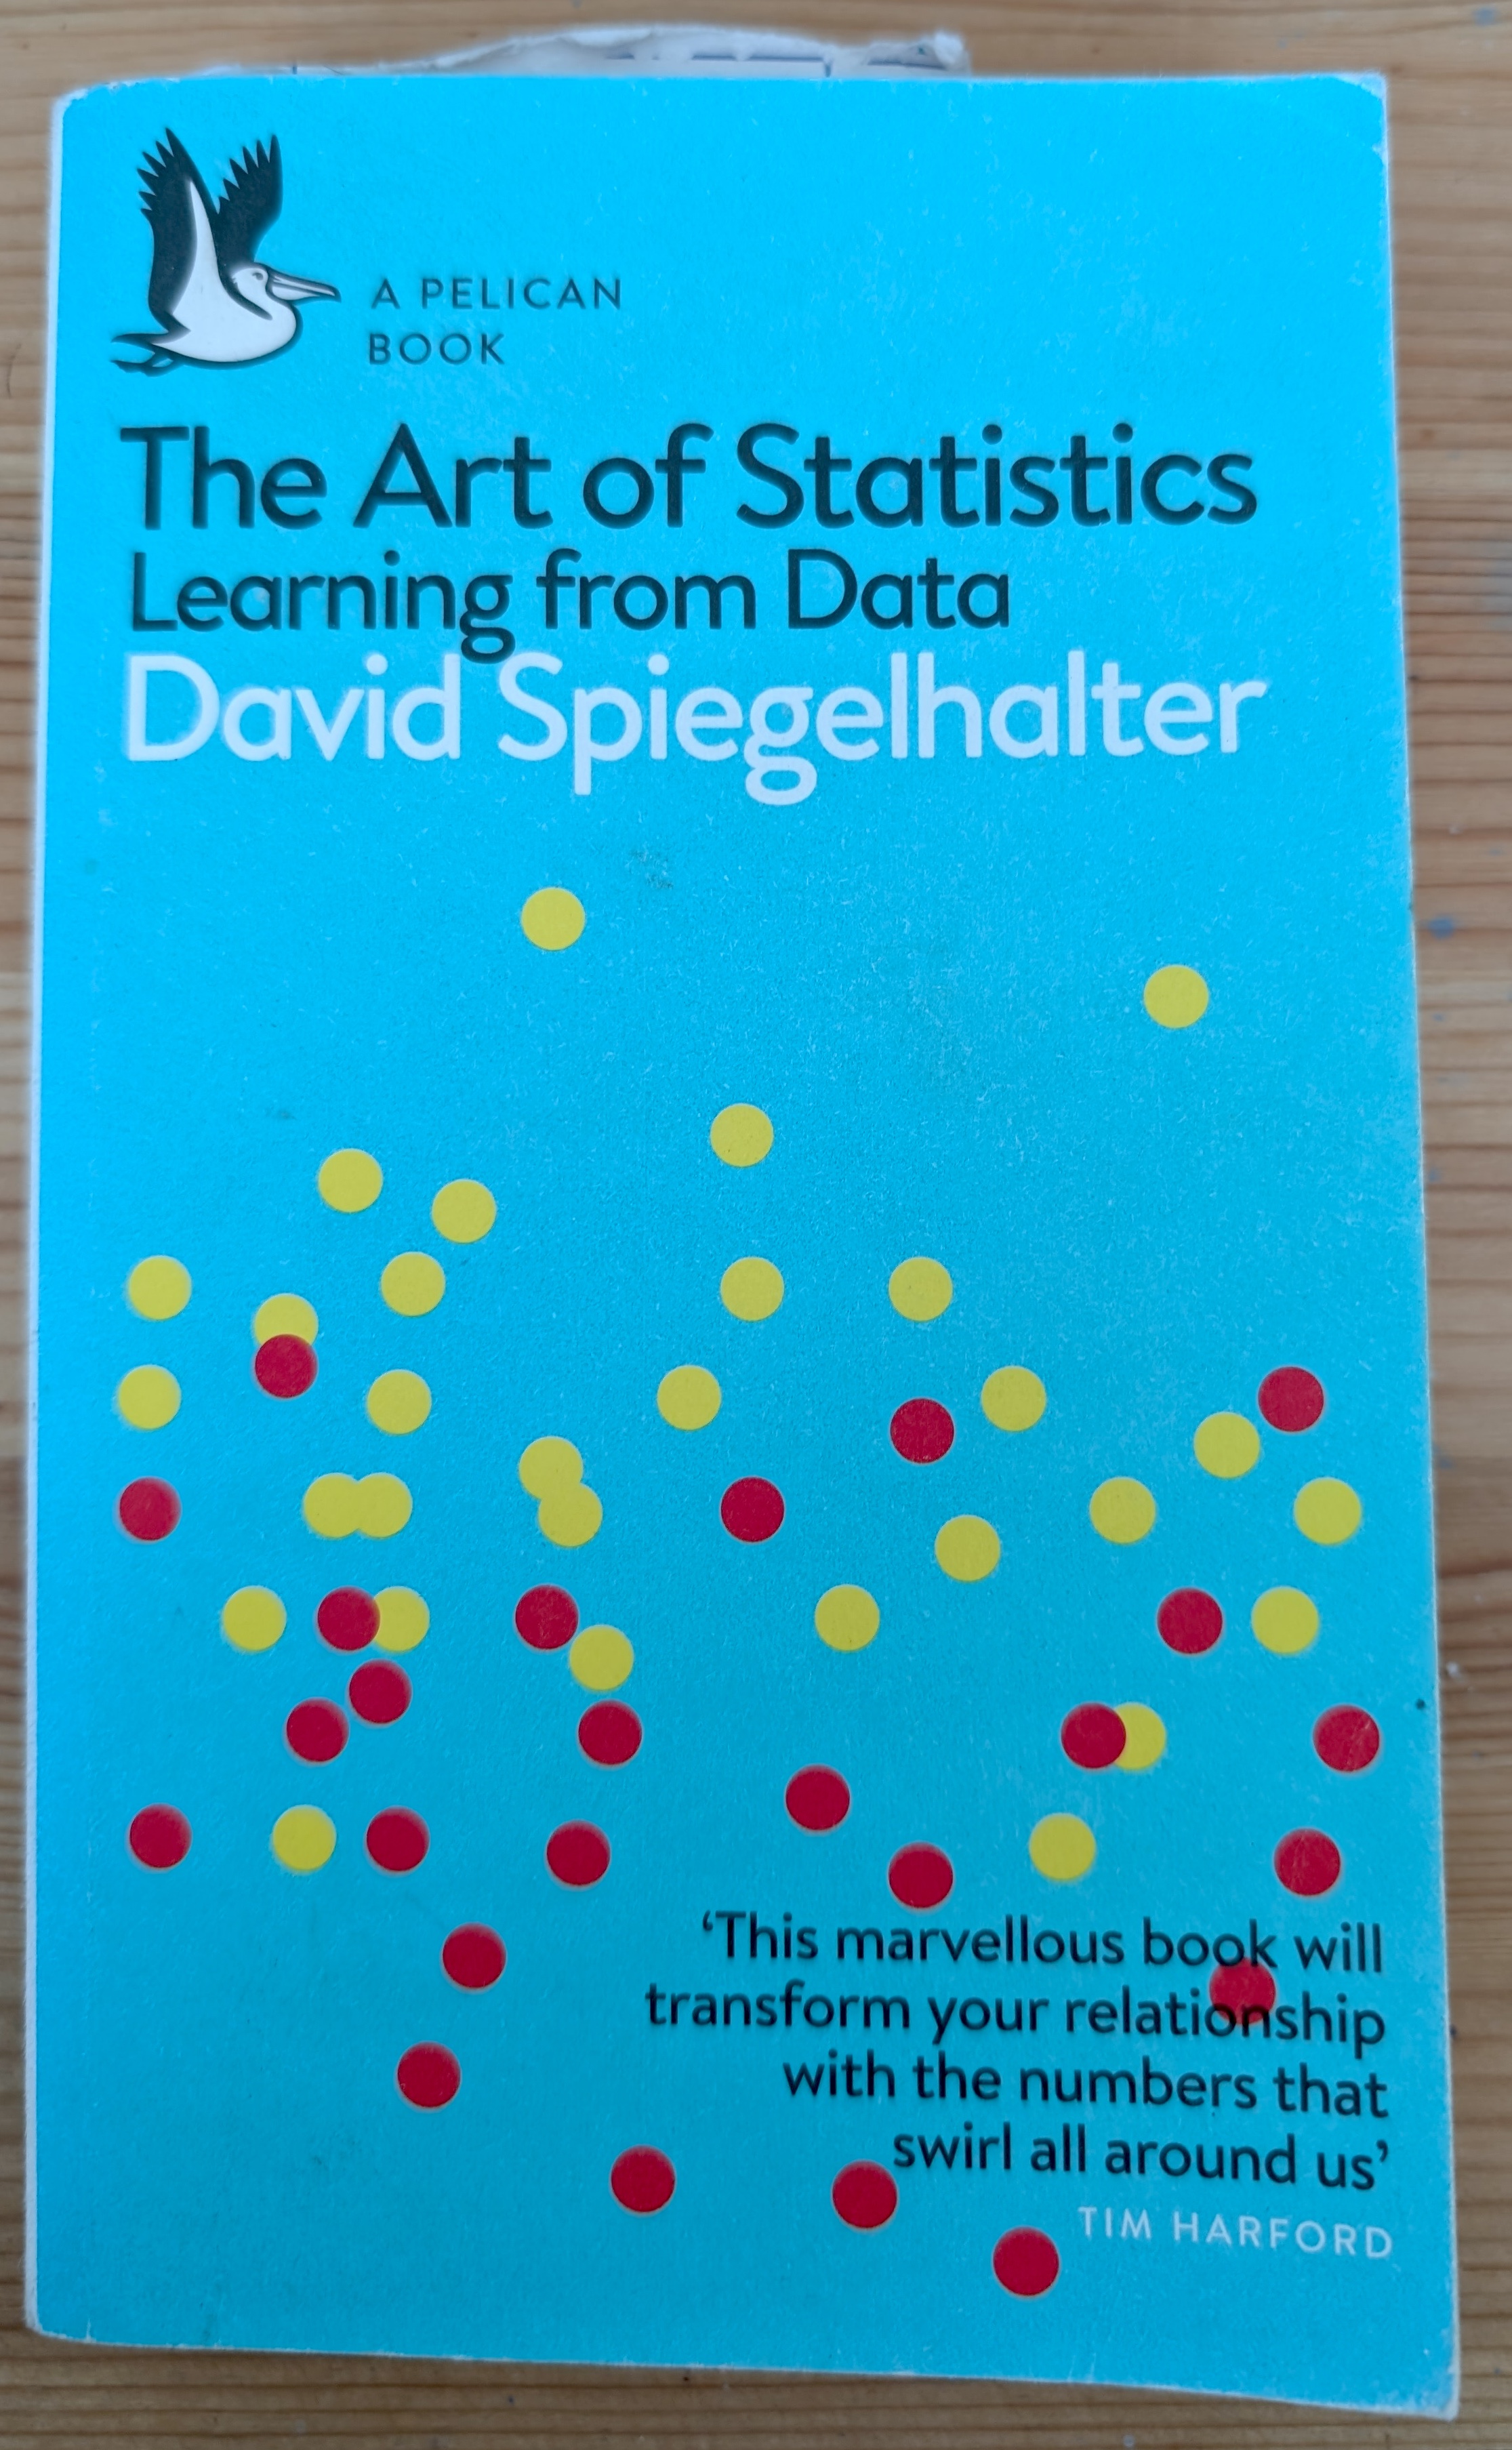
Our story begins in 2019, a simpler time when “pandemic” was just a scary word in a board game and sourdough starter wasn’t a mandatory kitchen accessory. I bright-eyed and bushy-tailed, decided to tackle this tome, convinced I would emerge a statistical savant, capable of predicting the lottery numbers and the exact moment my toast would burn.
Turns out, statistics is a bit more complicated than the pie charts I used to colour in at school. Who knew? So began my years-long wrestling match with this book. I’d read a chapter, feel my brain cells staging a mass exodus, and promptly retreat to the soothing embrace of a comic, minecraft or Fortnite. Rinse and repeat.
But like a stubborn stain on my favorite shirt, I just couldn’t get rid of this book. So, I persevered. I re-read chapters. I Googled terms that sounded like they belonged in a Harry Potter spellbook (“heteroscedasticity,” anyone?). I even resorted to drawing diagrams on my windows with dry-erase markers (much to the confusion of my neighbours).
And slowly, miraculously, something started to click. David Spiegelhalter, bless his statistically significant heart, has a way of making even the most mind-bending concepts understandable. He’s like the data whisperer, the statistical Yoda, the… okay, I’ll stop with the analogies. But seriously, his writing is engaging, witty, and surprisingly relatable. Plus, the examples he uses are fascinating – from the probability of winning the lottery (spoiler alert: don’t quit your day job) to the statistical quirks of birth dates and death rates.
This book, my friends, was a journey. A statistical odyssey, if you will. It challenged me, frustrated me, and ultimately, inspired me. It sparked a curiosity about data that led me to the Google Data Analytics course I’m currently immersed in (more on that in another blog post, because this one is already longer than the average attention span, statistically speaking).
So, what’s the moral of the story? Well, first, never underestimate the power of a good book. Second, statistics can be fascinating. And third, if I can conquer “The Art of Statistics,” then by the transitive property of awesomeness, I can probably conquer this data analytics course too.
P.S. Pelican Books, you guys are the real MVPs. Bringing back all those school textbook memories (the good ones, mostly). And for publishing this gem of a book? You deserve a statistically significant high-five.